Can Facebook or Other Social Media Reduce Your Productivity?

We have never had a Facebook account, because we perceived it as a time-waster, fun for people who didn’t have day jobs and accepted the occasional scandals and the fact that their memberships had made Mark Zuckerberg outrageously wealthy. But more recently people have realized not only how much time they had wasted but also how depressed they were and how many impulse purchases it had caused. Although some people want to make sure they don’t miss out of what’s happening, and others actually use Facebook as part of their job, on balance people agree that Facebook does reduce their productivity. And a 2015 survey of people who have to make decisions found that 86% of them believe that social media are not useful. Social media companies like Facebook are a poor substitute for personal meetings.  Zoom and similar alternatives are better for taking care of people that are not present.

Why Did Polls Predict 2016 U.S. Presidental Election Result So Badly?

presidentialpolls4-550x366

There aren’t many, or any, surveys with more respondents than the polling accompanying U.S. presidential elections. And all such polls have error, both from simple randomness and from non-response bias. This year’s inaccuracy was not the first flagrant example. In 1948 newspapers trumpeted incorrectly that Dewey had beat Truman.

The 2016 election had an important source of randomness and confusion, namely the unpredictable behavior of Donald Trump. And one of the other sources of confusion was the difference between the Electoral College (whose results are the ones used to determine the winner) and the popular vote (which is interesting but not governing). It is still not clear as of November 14 (nearly a week after Election Day), but it appears that Hillary Clinton won the popular vote, and any polling that dealt mainly with the popular vote could easily draw the wrong conclusion.

Additional errors can arise from the inconsistency among the states regarding mail-in ballots or voting places open as early as September 19. The 46 million early voters (prior to election day) included a large number of unaffiliated (neither Democratic nor Republican) voters, making it hard to predict voter behavior on election day. (The total voter count was 130 million.) Beyond this, voter turnout apparently wasn’t predicted accurately

Traditional telephone polling also was a source of errors. Some people intending to vote for Trump were ashamed to admit it when they were surveyed with live interviews. Automated-dialer calls with recorded voice and Internet polling gave better results. But these calls cannot be used with cellphones.

Of all the analyses of the causes of the inaccuracy of the polls, we found the ones by Sean Trende on Rear Clear Politics the most helpful. Most perceptive was his finding that the polls were OK, but the conclusions by the pundits weren’t.

Does the Brevity of Instagram, SnapChat, Twitter, et al Reflect their Paucity of Useful Content ?

instagramandsnapchat-550x241

Modern technology—especially all things enabled by the Internet—continues to produce miracles that could only be fantasized about a few short years ago. Among those miracles is a whole family of social networks, all of which offer near-instantaneously gratification. One can debate the extent of benefits offered by each of the social networks, but the billion-plus active Facebook users strongly implies that THEY believe in the benefits. And there are continuing examples where people can connect with their loved ones despite disasters, or just stay in touch simply and quickly. We wonder, however, if Instagram, SnapChat, Twitter, and their ilk are in the same league. The fact that the small amount of content (regardless of how clever it is) leaves as fast as it arrives suggests that it doesn’t have lasting value. In fact, this lack of permanance probably is a GOOD thing for many of the teenagers who are a considerable portion of the recipients. But actually, it appears that more and more teenagers are choosing to communicate in person, so it may be that they are tiring of the high volume of stuff with little lasting value.

Those Who Live by Google Analytics Shall Die by Google Analytics

LiveByTheSword1 542x361

We at Wild Bill Web Enterpises have been tracking the visitors (and other metrics) for our three websites–including TechnologyBloopers, WhyMenDieYoung, and Wilddancer—on a weekly basis using Google Analytics and on a monthly basis using our ISP for nearly two years, and are baffled by the helter-skelter, all-over-the-map, random-looking numbers Google Analytics is providing us. Apparently this is a common problem, with a lot of possible causes, including some possibilities that could be our fault (well, the lack of useful guidance from Google and other sources isn’t really OUR fault). And it isn’t that our visitor volume is so high that we are the victim of Google’s sampling process. But we, and probably millions of other website developers, find it highly difficult, even impossible, to make any decisions based on this data. Why don’t the Internet and the Web take advantage of the huge computing power of the hardware and software to provide reasonably accurate statistics so that we can make things easier and more productive for both us and our visitors?

“Prediction is difficult, especially about the future”

YogiBerra4NielsBohr 600x450

Whether this truism came from Yogi Berra or Niels Bohr isn’t the point. We’ve made our share of bad forecasts, so can’t cast the first stone at the partners of Play Bigger Advisors for their July 15, 2015 analysis as to why FitBit should be trumped by GoPro. However, on June 1, 2016 the market capitalization for FitBit was $3.13 billion while that of GoPro was $1.44 billion. But we are not in the business of advising small companies how to get bigger faster, nor publishing a book called Play Bigger: How Pirates, Dreamers, and Innovators Create and Dominate Markets.

Surveymania: A Toxic Internet Disease

DopeySurveys-Pickles 550x261

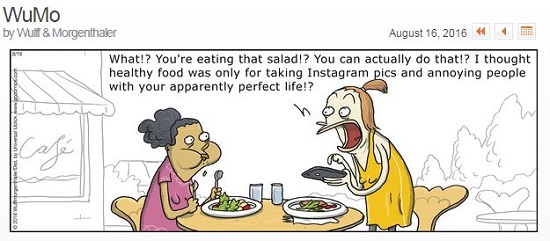
Just because you CAN do something doesn’t mean you SHOULD do something. Unfortunately, the millions of souls around the world writing software are adding functionality a lot faster than overburdened consumers can use it. We can’t think of a better example of this than the now-omnipresent survey that arrives in our Inboxes within microseconds of our buying a product or using a service. The volume of junk snail mail is minuscule compared with that of junk email and junk surveys. Our own productivity and enjoyment of life are victims of this trend.

Well, you say, if we don’t vote for what we want, we are likely to be a victim of those lowlifes who do vote … for bad products and services. The best defense is to delete most all such surveys … heresy coming from a career market researcher, no? Certainly you should delete ones that clearly are just knee-jerk reactions from your suppliers. Worst are the ones that are pure bureaucracy, usually characterized by (1) purely multiple-choice questions with no open-ended ones where some insight may lie, and (2) a preponderance of questions about unimportant aspects but none or few about important ones. A recent one from Stanford Health Care was rife with such useless questions as (1) ease of scheduling your appointment , (2) minutes waited between scheduled appointment time and call to an exam room, (3) minutes waited in the exam room before being seen by a medical person, and (4) friendliness/courtesy of the nurse/assistant; nothing at all about the quality of the doctor’s diagnosis or the outcome of his/her prescribed treatment.

Perhaps even worse were those organizations who should, or even do, encourage feedback to correct their errors or improve their offerings, but then don’t take any action or even thank you. Google Translate, Google Maps, and Spreadshirt (custom T-shirts) come to mind. There is a time-tested principle that the best suppliers are those who listen to their customers and take actions to fix their errors or improve their products or services.

Americans Flunk OECD Literacy and Numeracy Tests

Innumeracy1 500x395

Maybe they couldn’t read the test? We wouldn’t be too surprised about the literacy tests. Nearly all of the other countries have to know a lot of English in addition to their own native languages. That forces them to do a better job of understanding the STRUCTURE of both languages and of thinking in multiple languages. But the technological accomplishments by Americans as a group are so impressive that it is nearly unbelievable that they rank dead last among the 18 top industrial countries according to an OECD report published in 2013. Unfortunately, it is hard to dig into the OECD (Organisation for Economic Co-operation and Development) research and its followup (which appears to be what triggered the Wall Street Journal article at this time) because the background, while numerate, is not presented in a literate manner. We sink into a swamp of academic gibberish.

Professor Andrew Hacker is not surprised at these abysmal results, as he believes that most American high schools and colleges teach math the wrong way. We at Technology Bloopers agree. We survived a lot of advanced math classes up through the masters level and wrote a PhD thesis full of statistical formulae. But most of what we—and most of the American populace–needed to know we learned by the end of eighth grade if we were diligent. Things like fractions and percentages. And some of the rest we might have learned even earlier in school by using Microsoft PowerPoint or Apple Keynote. Do most of us really need algebra? Or geometry (though there are some practical applications of concepts such as the Pythagorean Theorem (e.g., you can check for a square corner by using a tape measure and knowing that if you measure 3, 4, and 5 units on each of the 3 sides that the angle opposite the 5 side is a right angle, i.e., a square corner) even if you have no clue who Pythagoras was). Hopefully, by the time we graduate from high school we will have been exposed to simple column graphs like the one showing the OECD rankings, and have learned that the tiny differences it shows from country to country may not be significant. BUT, the gap between Japan and the Scandinavian countries on the one hand and the U.S. on the other hand probably is significant … and we need to change how we teach math and numbers to Americans.

Presidential Race Polls Inaccuracy Is Exceeded Only By Their Number

PresidentialPolls2 480x360

Who needs the comic strips in the morning papers these days? The latest antics of the U.S. presidential candidates and the pollsters are a lot more amusing. And this phenomenon is not new; we even featured it in our December 2014 post regarding the off-base headline trumpeting the victory of Dewey over Truman (sic). In alll fairness, it is not at all easy to do a good political poll, and the current campaigns in the U.S. may be among the most weird in history, due to the unpredictable behavior of Donald Trump, the political baggage of Hilary Clinton, and most recently Ted Cruz’s claim that Ben Carson was dropping out of the race. But there are some big limitations in the polls themselves, most importantly that so many people polled don’t vote and so many people who do vote don’t get polled. And these gaffes are not limited to the U.S. In May 2015 in the U.K. the polls predicted that the vote would be divided equally between Conservative and Labour candidates, but the actual results favored the Conservatives, and Prime Minister David Cameron. Again, the villain was a poor choice of the sample, which included too many younger and politically active voters at the expense of under-sampling older voters.

Older Americans Buy More High-Tech Products Than You Think

GenerationBuyingHabits3 550x460

Just because people 35 and older don’t constantly have a smartphone in their hand doesn’t mean that they don’t buy a lot … including high-tech products. According to the 2010 Census, the Silent Generation (those aged 65-89) comprises 25% of the US population, Baby Boomers (aged 45-64) 30%, GenX (aged 35-44) 14%, and Millenials (aged 18-34) 32%. According to a 2014 Synchrony Financial report, the Baby Boomer generation is a shopping force 65 million strong, accounting for a large percentage of retail sales. And Baby Boomers hold 77% of the U.S. wealth and they spend 15 hours per week online — two hours longer than teenagers.

The Wall Street Journal’s Readers’ Most Annoying Technology Failures

WSJ Tech Nuisances Composite Chart 761x286

Two of The Journal’s technology writers led off with their own “Dirty Dozen” of most annoying technology failures in the March 11, 2015 issue, then followed up a week later with their analysis of readers’ comments. Thanks to our long background in surveys and statistics we at Technology Bloopers are well aware of the limitations of this data, but its high-level source and its “essay” type answers (as opposed to the all-too-frequent cookie cutter “multiple choice” questionnaires that flood everyone daily) were too tempting to pass up. (Note: Some commenters provided two or more unrelated comments, and we counted them separately, so strictly speaking the data we analyzed was about comments, not commenters.) We well realize that the sample is highly biased, but it is a very useful sort of bias; these commenters should be somewhat more knowledgeable, more powerful, and more well-paid than a random sample. So their comments, thoughtfully analyzed, should be very useful. But we can even further separate the comments into above-average and below-average knowledgeability by whether or not their comment was accompanied by a “gravatar” (i.e., “global avatar”, the little picture they use as a graphical representation of their Web presence, kind of an online logo). We were surprised that only about 28% of the responses came from the below-average-knowledge group.

The charts immediately tell a lot of the story: Passwords are the #1 most annoying technology failure (and this is true whether we’re talking about the whole group or only the above-average-knowledge subgroup). The combined complaints about the Wall Street Journal itself (bad technical support, bad advertising, bad comment system, bad mobile device app, and bad website) was #2 for the group as a whole but was mainly for the below-average-knowledge subgroup. Bad documentation/(technical) support and bad logic/user interface tied for #3, but the former had numerous above-average-knowledge commenters while the latter had very few. Two other annoyances that fell just below the top 6 shown in the chart were “Too Complex” and “Facebook is Not Essential”.