Americans Flunk OECD Literacy and Numeracy Tests

Innumeracy1 500x395

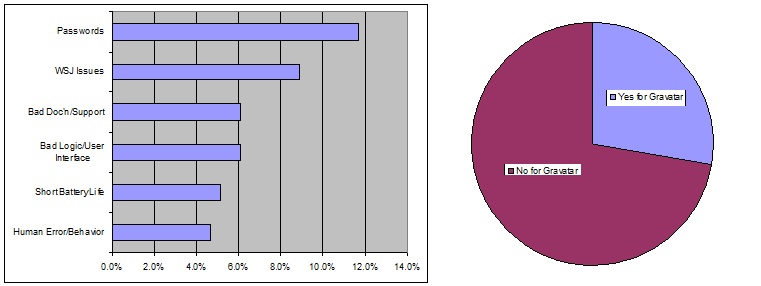
Maybe they couldn’t read the test? We wouldn’t be too surprised about the literacy tests. Nearly all of the other countries have to know a lot of English in addition to their own native languages. That forces them to do a better job of understanding the STRUCTURE of both languages and of thinking in multiple languages. But the technological accomplishments by Americans as a group are so impressive that it is nearly unbelievable that they rank dead last among the 18 top industrial countries according to an OECD report published in 2013. Unfortunately, it is hard to dig into the OECD (Organisation for Economic Co-operation and Development) research and its followup (which appears to be what triggered the Wall Street Journal article at this time) because the background, while numerate, is not presented in a literate manner. We sink into a swamp of academic gibberish.

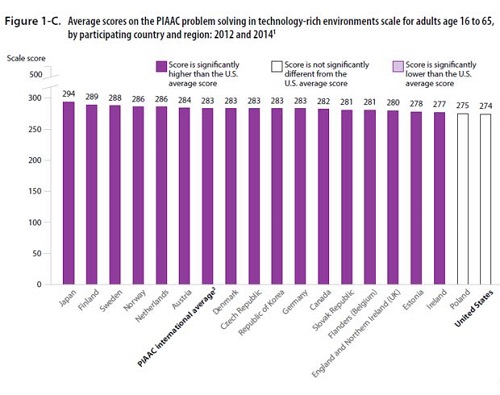
Professor Andrew Hacker is not surprised at these abysmal results, as he believes that most American high schools and colleges teach math the wrong way. We at Technology Bloopers agree. We survived a lot of advanced math classes up through the masters level and wrote a PhD thesis full of statistical formulae. But most of what we—and most of the American populace–needed to know we learned by the end of eighth grade if we were diligent. Things like fractions and percentages. And some of the rest we might have learned even earlier in school by using Microsoft PowerPoint or Apple Keynote. Do most of us really need algebra? Or geometry (though there are some practical applications of concepts such as the Pythagorean Theorem (e.g., you can check for a square corner by using a tape measure and knowing that if you measure 3, 4, and 5 units on each of the 3 sides that the angle opposite the 5 side is a right angle, i.e., a square corner) even if you have no clue who Pythagoras was). Hopefully, by the time we graduate from high school we will have been exposed to simple column graphs like the one showing the OECD rankings, and have learned that the tiny differences it shows from country to country may not be significant. BUT, the gap between Japan and the Scandinavian countries on the one hand and the U.S. on the other hand probably is significant … and we need to change how we teach math and numbers to Americans.

The Wall Street Journal’s Readers’ Most Annoying Technology Failures

WSJ Tech Nuisances Composite Chart 761x286

Two of The Journal’s technology writers led off with their own “Dirty Dozen” of most annoying technology failures in the March 11, 2015 issue, then followed up a week later with their analysis of readers’ comments. Thanks to our long background in surveys and statistics we at Technology Bloopers are well aware of the limitations of this data, but its high-level source and its “essay” type answers (as opposed to the all-too-frequent cookie cutter “multiple choice” questionnaires that flood everyone daily) were too tempting to pass up. (Note: Some commenters provided two or more unrelated comments, and we counted them separately, so strictly speaking the data we analyzed was about comments, not commenters.) We well realize that the sample is highly biased, but it is a very useful sort of bias; these commenters should be somewhat more knowledgeable, more powerful, and more well-paid than a random sample. So their comments, thoughtfully analyzed, should be very useful. But we can even further separate the comments into above-average and below-average knowledgeability by whether or not their comment was accompanied by a “gravatar” (i.e., “global avatar”, the little picture they use as a graphical representation of their Web presence, kind of an online logo). We were surprised that only about 28% of the responses came from the below-average-knowledge group.

The charts immediately tell a lot of the story: Passwords are the #1 most annoying technology failure (and this is true whether we’re talking about the whole group or only the above-average-knowledge subgroup). The combined complaints about the Wall Street Journal itself (bad technical support, bad advertising, bad comment system, bad mobile device app, and bad website) was #2 for the group as a whole but was mainly for the below-average-knowledge subgroup. Bad documentation/(technical) support and bad logic/user interface tied for #3, but the former had numerous above-average-knowledge commenters while the latter had very few. Two other annoyances that fell just below the top 6 shown in the chart were “Too Complex” and “Facebook is Not Essential”.

Resolution Confusion: 4K TV’s, Apple Retina, and Lower-Resolution Displays

4K resolution 600x400

The original goal of large-screen High Definition (HD) TV was to provide an immersive viewing experience. In order to achieve this the picture needed to be large enough to fill the viewer’s field of vision but to have small-enough pixels that the viewer could not see individual pixels. What’s a pixel? It means “picture element” (or “dot”, to most of us). Obviously, the more dots the better the picture quality. But more dots costs more money, so people buying TV sets or other displays (e.g., personal computers, tablets, or smartphones) may need to trade off image quality vs. cost. Fortunately, the constant advancement in technology means that displays keep becoming better and cheaper. The big deal in TV screen quality today is 4K. What’s that? It’s actually 4096×2160 (horizontal x vertical) pixels (4096 is 4K). Practically speaking, where displays are concerned, literally “beauty is in the eye of the beholder”. It depends on how far your eyes are from the display, but if you can’t see individual pixels the resolution is probably high enough. Apple has made a big deal out of their 4K Retina displays, which are beautiful, but their high pixel density is unnecessarily high. And there is a huge amount of material that is viewed at far lower resolutions. Google Glass records its videos at 720p (1280×720 pixels), and a lot of YouTube videos are even considerably lower than this, maybe even lower than the old Standard Definition (SD) resolution of 640×480.